


12 novembre 2026

Abstrait
À première vue, le Manitoba semblait progresser régulièrement vers son engagement de créer 23 000 nouvelles places en services de garde d’enfants. Toutefois, lorsque nous avons examiné les données au-delà des totaux provinciaux, un portrait plus complexe s’est dessiné. Des places ouvraient et de nombreuses autres avaient été annoncées. Pourtant, une analyse plus approfondie des données a révélé des disparités d’accès, laissant supposer que les familles de certaines collectivités pourraient éprouver davantage de difficultés que d’autres à trouver une place. Elle a aussi soulevé une question : les progrès actuels suffiraient-ils à répondre non seulement à la cible fixée, mais aussi à la demande réelle ?
Cet article examine comment l’analyse de données a appuyé nos travaux d’audit de performance sur l’accès aux services de garde d’enfants et leur inclusivité au Manitoba. Plus précisément, il montre comment cette analyse nous a permis de dépasser les données globales sur le nombre de places pour mieux comprendre l’accessibilité des services, les pressions exercées sur la planification et les risques futurs. L’analyse a renforcé les éléments probants à l’appui de nos constatations en montrant où les données disponibles étaient suffisantes, où elles présentaient des limites et où des questions importantes demeuraient sans réponse.
Introduction
Les auditeurs de performance sont souvent appelés à évaluer si les plans, les processus et les résultats sont adéquats et permettent d’atteindre les objectifs d’un programme. Dans bien des cas, les organisations peuvent rendre compte de leurs activités, mais les renseignements disponibles ne suffisent pas toujours à démontrer que leurs efforts ciblent les bons endroits, répondent aux besoins les plus pressants ou suivent l’évolution des besoins futurs. C’était l’un des principaux enjeux de notre audit sur l’accès aux services de garde d’enfants et leur inclusivité au Manitoba..
Au début de notre audit, nous avons constaté que le ministère disposait de données sur les places en service et les places faisant l’objet d’engagements, ainsi que de certains outils de planification destinés à soutenir la prise de décisions. Cependant, à mesure que l’audit avançait, il est devenu évident que ces sources ne permettaient pas de déterminer pleinement où les besoins en matière d’accès étaient les plus pressants, comment ils variaient d’une région du Manitoba à l’autre, ni si les efforts de planification en cours permettraient vraisemblablement de respecter l’engagement du Manitoba de créer 23 000 places supplémentaires dans le cadre de l’Accord pancanadien sur l’apprentissage et la garde des jeunes enfants (APAGJE). Les résultats détaillés de cette analyse figurent dans notre rapport d’audit et dans le tableau de bord interactif qui l’accompagne.
L’analyse de données nous a permis d’aborder la question sous un autre angle. Une leçon se dégage de ces travaux : l’analyse nous a aidés à voir non seulement ce que les données révélaient, mais aussi ce qui manquait.
Des places déclarées à l’accessibilité réelle
Nous avons d’abord dépassé les chiffres provinciaux globaux pour examiner la répartition des places disponibles dans chaque collectivité. Les totaux provinciaux sont utiles pour la reddition de comptes, mais ils n’indiquent pas si les familles et les collectivités ont un accès raisonnable aux services de garde. L’accessibilité dépend de la géographie, de la population locale et de la proximité des établissements par rapport au lieu de résidence des enfants. Elle dépend également du fait qu’un même établissement peut desservir plusieurs secteurs, particulièrement à proximité des limites géographiques.
Pour mieux comprendre cette réalité, nous avons utilisé des estimations démographiques, l’emplacement des établissements et des regroupements géographiques afin d’examiner l’accessibilité à l’échelle des collectivités. Nous avons également utilisé les régions de tri d’acheminement (RTA), soit les zones géographiques définies par les trois premiers caractères d’un code postal, comme cadre géographique pour analyser la relation entre les places autorisées ou faisant l’objet d’engagements et la population d’enfants à l’intérieur et autour de ces zones.
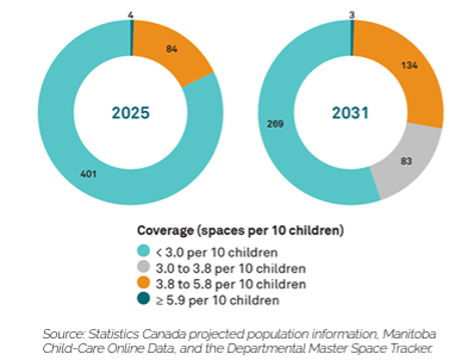
Pour cette analyse, nous avons converti l’engagement du Manitoba de créer 23 000 places en un seuil de référence fondé sur un taux de couverture d’environ 3,8 places pour 10 enfants, calculé à partir de la population des enfants de moins de sept ans au début de l’accord. Comme l’illustre la figure 1, la couverture projetée des services de garde varie considérablement d’une collectivité manitobaine à l’autre. Si certains secteurs devaient se rapprocher de l’équivalent, en taux de couverture, de la cible de 23 000 places, de nombreuses collectivités demeuraient bien en deçà de ce niveau.
Précisions méthodologiques
Comprendre l’accès aux services de garde ne se résume pas à compter les places dans une zone géographique. Les familles ne fréquentent pas nécessairement le centre de garde le plus proche de leur domicile, et de nombreux établissements accueillent des enfants des collectivités voisines, notamment près des limites municipales ou postales.
Pour mieux refléter la façon dont les familles accèdent aux services de garde, nous avons tenu compte de l’emplacement des places, de la population d’enfants et de la distance que les familles pourraient raisonnablement parcourir. Plutôt que d’attribuer les places d’un établissement uniquement à la zone où il se trouve, l’analyse reconnaissait que les établissements peuvent desservir des familles de plusieurs collectivités environnantes (Des précisions supplémentaires sur la méthodologie, les hypothèses et les calculs sont présentées dans notre rapport d’audit.
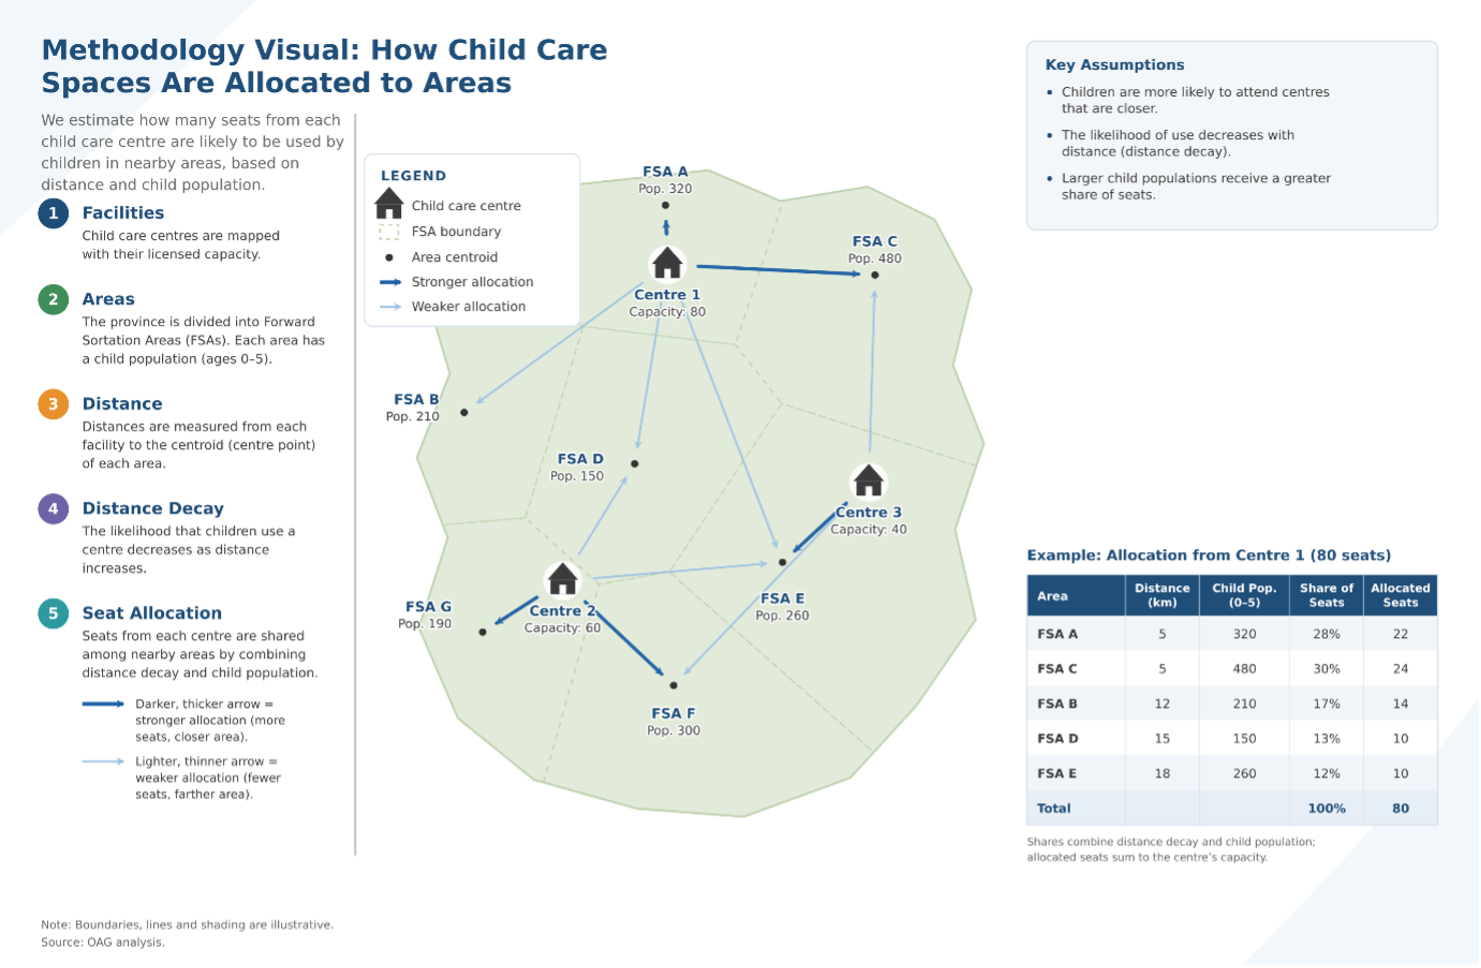
L’analyse tenait compte à la fois de la distance et de la population. Nous avons estimé la distance entre les établissements de garde et les zones géographiques avoisinantes, puis appliqué des facteurs de pondération selon la proximité et la taille de la population d’enfants dans chaque zone. Cette méthode permettait de répartir la capacité des établissements entre les collectivités voisines plutôt que de l’attribuer à un seul emplacement.
Concrètement, un centre de garde situé près de la limite d’une zone était considéré comme pouvant desservir les familles de plusieurs collectivités voisines. Cette approche fournit une estimation plus nuancée de l’accessibilité géographique que l’attribution de toutes les places exclusivement à la zone où se trouve l’établissement. La figure 2 illustre ce principe. Au lieu d’attribuer toutes les places à une seule zone géographique, le modèle d’accessibilité répartit la capacité entre les collectivités voisines en fonction de la distance et de la population, ce qui permet d’obtenir une estimation plus réaliste de l’accès.
This method gave us a reasonable way to assess accessibility with the available data and helped to identify communities where access pressures may persist despite planned growth in child care spaces.
This approach provided a useful estimate of geographic accessibility, not a measure of utilization. It did not incorporate all factors that may influence child care utilization, such as parental preferences, commuting patterns, transportation availability, or waitlist information.
The analysis also highlighted limitations in available data. Key information such as province-wide waitlists, facility closures, and geographic demand indicators were not consistently tracked or available, making it difficult to fully assess child care access and demand across Manitoba. While analytics could not compensate for these data gaps, it helped make them visible and strengthened the evidence supporting our audit findings.
Connecting access to implementation risk
Once we had a better understanding of access at the local level, the next step was to connect that to Manitoba’s commitment under the CWELCC Agreement. The department was reporting annually on the number of spaces that were open and committed, but our audit question was broader: Would the current pace of progress be enough to achieve 23,000 spaces within the required timeframe?
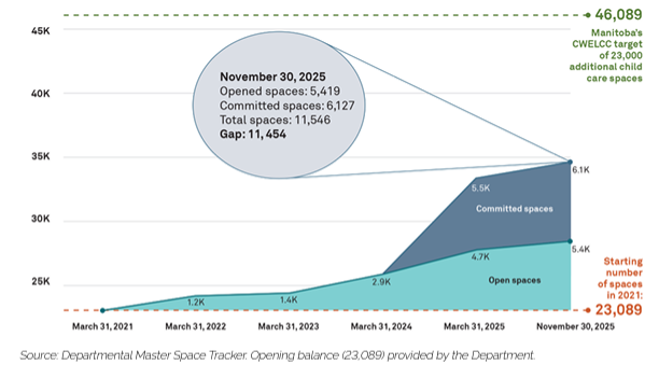
Using data on open and committed projects, we examined the department’s progress against Manitoba’s target of 23,000 additional spaces. Between 2021 and 2025, the department committed to an average of 2,309 spaces per year. Our analysis showed that these committed spaces typically take 18 months to four years to open and become operational.
Using historical commitment rates and observed timelines between commitment and operation, we projected that Manitoba would achieve the 23,000-space target by May 2031, with full operation not expected until sometime between 2032 and 2035. This meant Manitoba was unlikely to achieve its 23,000-space commitment by the March 31, 2026 deadline (the underlying assumptions and forecasting approach are discussed further in our audit report).
As shown in Figure 3, Manitoba had opened 5,419 spaces and committed a further 6,127 spaces by November 2025, leaving a substantial gap to the 23,000-space target. The visualization highlights both the number of spaces opened and committed to date, and the additional commitments that would be required to meet the original deadline.
This analysis was particularly useful in connecting implementation progress with future delivery risk. The report found that the department did not maintain province-wide waitlist information, did not continuously monitor space closures, and did not have a model that could estimate the number of spaces needed by area. It also showed how much more planning and analysis could be done with the information the department already has.
Analytics did not fill all those gaps, but it made them much harder to ignore. In that way, it strengthened the audit by showing not only where evidence existed, but also where management lacked the information needed for stronger planning.
Applying a coverage lens
Another helpful part of this work was the use of a coverage rate as a benchmark for comparison. We converted the 23,000 additional spaces from Manitoba’s CWELCC Agreement into a coverage-based target (38%). This allowed us to move beyond space counts and assess how well the planned number of spaces aligned with the distribution of Manitoba's population of children under seven.
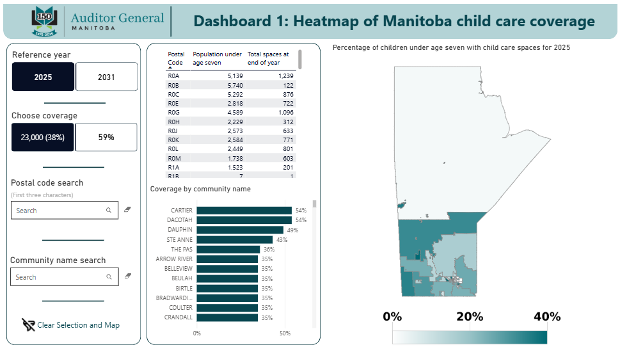
We then developed a publicly available interactive dashboard that allowed users to explore coverage across Manitoba by postal code and community. Our analysis compared the number of open child care spaces as of November 30, 2025, and projected open spaces in 2031, with the population of children in each area. We estimated the number of additional spaces needed to meet Manitoba’s CWELCC commitment of 23,000 spaces (38%) and a coverage benchmark of 59% of the population under age seven. Although a 59% coverage-based target is used in other provinces, Manitoba has not committed to a coverage-based target under CWELCC. We used a 59% coverage rate for illustrative purposes only.
While Manitoba's commitment was expressed as a target number of spaces rather than a coverage rate, the benchmark provided a practical way to put the target into context and examine how access varied across communities. It also helped illustrate where projected spaces may still fall short of achieving comparable levels of coverage.
Figure 4 shows the interactive dashboard we used to compare current and projected coverage rates across Manitoba communities and to estimate the number of additional spaces required under different planning scenarios.
From current gaps to future pressure
The next step was to ask what the projections meant for the future. If access was already uneven across communities, how might those pressures evolve as population and space commitments changed?
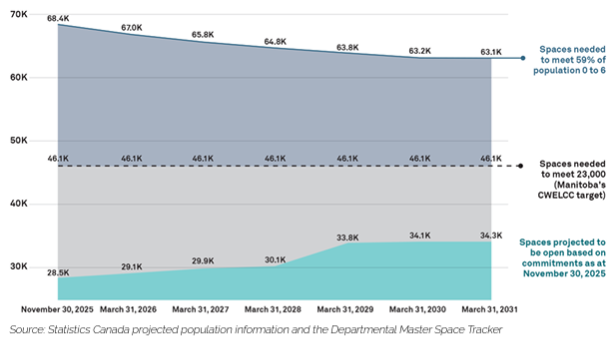
To help answer those questions, we used forecasting based on historical commitment patterns and observed timelines for projects to become operational. This allowed us to estimate when Manitoba would likely reach the 23,000-space target based on the pattern of commitments recorded up to November 2025, as well as typical timelines for those spaces to become operational. As with any forecast, the analysis assumes that historical patterns provide a reasonable basis for estimating future commitment rates, project completion timelines, population growth, and program implementation. Actual results may differ due to changes in funding, construction timelines, policy decisions, population growth, or other factors affecting child care expansion.
The analysis indicated that Manitoba was unlikely to achieve the 23,000-space target by the March 31, 2026 deadline and full operation of the required spaces would occur several years later. This provided a clearer picture of implementation risk and highlighted the scale of additional commitments that would be required to meet the target on time.
Figure 5 illustrates the relationship between projected space openings, population growth, Manitoba's 23,000-space commitment, and higher coverage benchmarks used elsewhere in Canada. The analysis suggests that projected growth in child care spaces is unlikely to close the gap within the timelines established by the agreement.
Forecasting also helped reinforce an important audit point: planning cannot rely only on present counts. The audit found that the department had not conducted this type of forward-looking analysis as part of its own planning. This mattered because forecasting is not simply a technical exercise; it is a management tool. It helps decision-makers understand whether current activity is aligned with future commitments and whether risks are building quietly in the background.
The area-level analysis supported this further. While additional spaces were expected to open in future years, projected coverage remained uneven across Manitoba. Some communities were expected to continue experiencing lower levels of access, even after committed projects became operational. This helped explain why accessibility remained a planning challenge despite significant investments and ongoing space creation efforts.
Limitations
As with any audit analytics, the results should be interpreted in light of the data and methodological limitations. Several important indicators of child care demand were not available. As noted in our report, the department did not maintain province-wide waitlist information, did not continuously monitor child care space closures, and did not have geographic estimates of the number of additional spaces needed by community. As a result, our analysis relied primarily on the relationship between child populations and the supply of licensed and committed child care spaces rather than direct measures of unmet demand.
Our analysis considered the location of child care facilities, child population estimates, and travel distance between communities and facilities. This approach assumes that proximity influences access and that facilities may serve families from multiple neighbouring communities rather than only the community in which they are located. However, actual child care choices may also be influenced by factors that were not included in the model, such as parental work locations, transportation options, program preferences, operating hours, and socioeconomic circumstances.
The forecasting analysis relied on historical population trends, departmental information on committed spaces, and observed timelines between commitments and facility openings. The projections assume continuity in historical trends and do not account for future policy changes, funding decisions, economic conditions, significant demographic shifts, or facility closures. Therefore, the forecasts should be viewed as illustrations of potential implementation risk rather than precise predictions of future outcomes.
Why analytics matter in audit work
One of the clearest lessons from this audit is that data analytics can play a meaningful role in performance audit work when they are used with care. They do not eliminate the need for professional judgment or a thorough understanding of the context, policy intent, or operational realities. What they do provide is another way to test whether the evidence supports the conclusions being drawn.
When used well, analytics can strengthen findings by reducing reliance on anecdote, better linking evidence to conclusions, and making gaps in information easier to identify. They can help auditors turn broad commitments into measurable questions, connect activity to future risk, and highlight whether management has the information needed to plan effectively.
What stood out most in this work was how much more became visible once the data was viewed differently. The underlying information already existed, but patterns in accessibility, community-level pressures, and emerging risks were not immediately apparent. Mapping and visualizing the data did more than illustrate the findings; it helped reveal questions we did not previously know to ask. Analytics showed that when strong questions guide the work, the same data can tell a more complete and meaningful story.
Ultimately, the value of analytics in audit work is that they help auditors better understand the issues they are examining and provide clearer, more persuasive evidence to support their findings.
References
[1] Sun, S.; Sun, Q.; Zhang, F.; Ma, J. A Spatial Accessibility Study of Public Hospitals: A Multi-Mode Gravity-Based Two-Step Floating Catchment Area Method. Appl. Sci. 2024, 14, 7713. https://doi.org/10.3390/app14177713
[2] Liu, L.; Lyu, H.; Zhao, Y.; Zhou, D. An Improved Two-Step Floating Catchment Area (2SFCA) Method for Measuring Spatial Accessibility to Elderly Care Facilities in Xi’an, China. Int. J. Environ. Res. Public Health 2022, 19, 11465. https://doi.org/10.3390/ijerph191811465
[3] Liao, Y.; Furuya, K. A Case Study on Children’s Accessibility in Urban Parks in Changsha City, China: Developing an Improved 2SFCA Method. Land 2024, 13, 1522. https://doi.org/10.3390/land13091522
About the Authors
Marcia Vogt
Principal, Performance Audit
Office of the Auditor General of Manitoba
Marcia Vogt is a Principal with the Office of the Auditor General of Manitoba and a CPA, CA with nearly 20 years of experience in accounting and auditing across the public and private sectors. Since returning to the Office in 2022, she has led and contributed to multiple performance audits, including Efficiency of Court Services for the Provincial Court of Manitoba (2023) and Child Care Access and Inclusivity in Manitoba (2026).
Prior to returning to the Office, Marcia worked in Internal Audit with the Department of Finance and previously conducted financial statement audits with the Office of the Auditor General. Her experience spans governance, compliance, operational, and performance auditing, as well as work in the manufacturing, financial services, and higher education sectors.
Gabriel Nazario
Data Analyst
Office of the Auditor General of Manitoba
Gabriel (Gabe) is the Data Analyst with the Office of the Auditor General of Manitoba. He joined the Office in 2023 and leads the Office’s data analytics work across financial statement, performance, investigative, and IT audits. His responsibilities include developing data analytics guidance and standards and delivering training to staff.
Prior to joining the Office, Gabe worked in the private sector as a quality engineer, where he applied statistical methods and data analytics to support quality improvement. He holds a Bachelor’s degree in Mechanical Engineering from the Sociedade de Assistência aos Trabalhadores do Carvão (SATC) in Brazil, which he completed in 2014, and a Diploma in Mechanical Engineering Technology from Red River College, completed in 2020.
- 1
- 2

 LinkedIn
 Twitter