
Introduction
Governments collect vast amounts of information and have a growing interest in using data to make better decisions. However, several factors may slow their progress. These include lack of time, resources, expertise, tools, and—sometimes—policy direction to use data.
Auditors often audit government programs, activities, or services that create data that has not yet been used to figure out their impact or effectiveness. In the past, this would typically have led to audit findings such as “the ministry does not know whether its program is effective,” or “the ministry has not analyzed its data to assess whether it has achieved its goals and objectives.” This would be followed by a recommendation that the ministry “analyze its data to determine the program’s effectiveness,” or sometimes, “collect and analyze data that allow it to assess program outcomes.”
In recent years, legislative auditors have started to venture beyond these types of findings and recommendations, to use data analytics tools and techniques to carry out effectiveness analysis themselves. The reasons for doing this include:
- Auditors have access to tools and expertise that governments do not always have access to.
- Auditors bring a fresh view on how government activities could be analyzed and understood.
- Auditors have access to data across different parts of government that allow them to do analysis that ministries and agencies may not be able to do because they work in silos.
- Program managers may be pressured to focus resources on front-line service delivery and therefore find it hard to justify data analysis until it has been proven to be worthwhile.
- Programs have rarely planned for data analysis at an early enough stage to allow for efficient data collection, making it more resource intensive to do analysis after programs are up and running. Auditors may have more time and resources to overcome this constraint than program managers do.
Audit offices have recognized that they can demonstrate to governments the value of data analytics by providing concrete examples of good data analytics work. This can inspire governments to take on data analytics themselves and use this information to make better policy decisions. When the conditions align and allow auditors to produce valuable analysis, they can better serve the needs of their legislature.
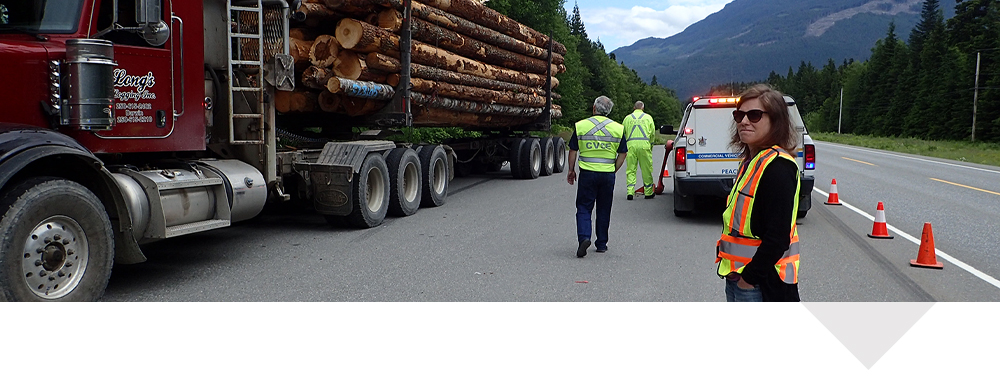
This article presents an example where the Office of the Auditor General of British Columbia was able to do this kind of data analysis work, in an audit on commercial vehicle safety published in December 2018. The audit examined whether three provincial organizations effectively managed their respective programs to promote the safe operation of commercial vehicles on B.C. roads.
Why did we decide to carry out this data analysis?

Government vehicle safety activities, including roadside inspections and traffic enforcement, are often seen primarily as a cost and a hindrance to the free flow of transportation. Being able to estimate the safety benefits, including reduced crashes, and cost impact of preventive activities helps to demonstrate their value and gives better information for those who must make cost–benefit decisions. This information is also important for legislators.
We were initially inspired by a presentation by the Office of the Auditor General of Nova Scotia at a CCOLA performance audit symposium. In a 2009 audit on truck safety, the Nova Scotia OAG carried out data analysis to assess whether the government had met its service standards for commercial vehicle inspections. We contracted with a subject matter expert from the University of British Columbia, Professor Garland Chow, to advise us on carrying out this type of data analysis.
How did we approach the data analysis?
The following are the steps we took to prepare the model and the data for analysis.
1. Identify a potential model for assessing the impact of commercial vehicle safety activities.
Professor Chow identified the Roadside Intervention Effectiveness Model (RIEM), a model used in the United States, as a likely candidate.
2. Confirm with our ministry contacts that the model would apply in the B.C. context.
We validated the model with the Ministry of Transportation and Infrastructure. We shared background information on the model with our key ministry contacts and showed them how the results were being used in the United States. Because the RIEM was being used across all U.S. states, and commercial vehicle safety standards and enforcement are similar between Canada and the U.S., we proposed that it would be reasonable to extend the model to B.C., with some adaptation.
3. Seek input from the researchers responsible for the model.
We sought input on our plan and approach from the researchers overseeing the RIEM work at the U.S. Department of Transportation.
4. Adapt the model to the B.C. context and data.
The ministry provided us with data on B.C. roadside inspections and traffic enforcement as well as the violations identified during those activities—the key input into the model. The ministry also gave us the table used in Canada to ensure equivalency in motor vehicle violations across jurisdictions, which we used to classify B.C.’s violation groups into the RIEM violation groups.
We determined that most of the violation group definitions were the same between B.C. and the RIEM. However, some RIEM violation groups were not defined or used in B.C., and vice versa. Also, some of the B.C. violation group classifications for roadside inspections were more aggregated than the RIEM ones. There were also violations classified as “miscellaneous” by B.C., which we had to reclassify before they could be used in the model.
To minimize the difference between the classifications of violation groups and maximize the accuracy of the estimates of crashes prevented, we used a number of procedures. These included asking the ministry staff to confirm the matching of the B.C. violation groups to the RIEM ones, and estimating the potential impact of preventive activities not measured in B.C., as well as the potential impact of activities conducted in B.C. but not recognized in the RIEM model.
5. Clean the data and run it through the model.
The biggest task in cleaning the data was ensuring there was no “double-counting” of violations that were found through both the inspection process and the traffic enforcement ticketing.
Page 1 of 2
About the Author

Jessica Schafer has been at the Office of the Auditor General of British Columbia since 2009 and is currently a performance audit manager. She has a special interest in data analytics for auditing and has experimented with data analysis techniques in a number of audits. She is a member of the CCOLA education study group, has mentored CAAF international fellows, and has helped CAAF develop its evidence collection and analysis course, as well as its discussion paper on root cause analysis.
Prior to auditing, she was an academic working in community and international development and African studies at the University of Sussex, University of Oxford, University of Victoria, and University of Ottawa.
Contact the author at:
- 1
- 2
