

Applying data analytics to employee surveys using Python
Python is a state-of-the art, free, and open-source programming language. For auditors who have recognized that being able to code is one of the skills requirements of the digital age, Python is perhaps the easiest language to learn. Any auditors who are familiar with creating functions in Excel should have no difficulty taking advantage of the general-purpose modules in Python’s libraries to rapidly and consistently perform any of the financial, math, statistical, or logical functions in Excel. Among others, significant advantages with Python are that there is no limitation on file size, and once a program is created, the same complex set of functions can rapidly be applied to every cell in a file without further copying and pasting. Some commercially available data analysis software commonly used by auditors, such as IDEA or ACL, now come with Python integrated, and an internal auditor with intermediate-level Python skills could implement sophisticated data analytics or even machine learning2 algorithms that complement the software’s pre-existing capabilities. For auditors with limited programming skills, it may be possible to do the same by working in collaboration with a data scientist or programmer colleague.
One of the challenges in applying data analytics to employee surveys is that sample sizes can be small, and the data is inherently fuzzy (i.e., vague, imprecise, lacking in certainty, and subject to confounding factors). What does it mean, for example, to say that the aggregate response score of the engineers is 20% less than the average response score across all groups? The important point is often not the amount by which a group is dissatisfied (unless it is extreme), but that it is more dissatisfied than other groups, which can then lead to a review of differing cultural factors across groups. In fact, the fuzziness of the data, combined with small sample sizes, makes it qualitative rather than quantitative, which means that numerical statistical functions—such as Pearson, chi-square, or regression analysis—do not produce reliable results in such a context.
This raises the question of whether or not there is a data analytic function in a Python library that would find associations between questions based on an attribute, such as above or below average, which being an attribute rather than a value is inherently fuzzy. There is indeed such a data analytic function, called the Gini function. It is used in machine learning to build decision trees that predict when an outcome is likely to occur based on the pattern of the inputs. For example, it can be used to predict fraud, or bad loans, or some medical problems, such as diabetes. However, in analyzing survey data, we do not want to predict an outcome: we merely want to know whether responses are associated based on whether their scores tend to vary above and below average together.
To this end, I have developed a Python program that borrows the Gini algorithm from machine learning and implements it outside of a decision tree. Rather than build a decision tree, the program applies a Gini function to pairs of the aggregate response scores of questions in a survey. The result is a large table, containing the Gini index of each pair of questions, one corner of which is shown in Figure 2.
Figure 2 – Example of a Table Showing the Gini Scores for Pairs of Questions
|
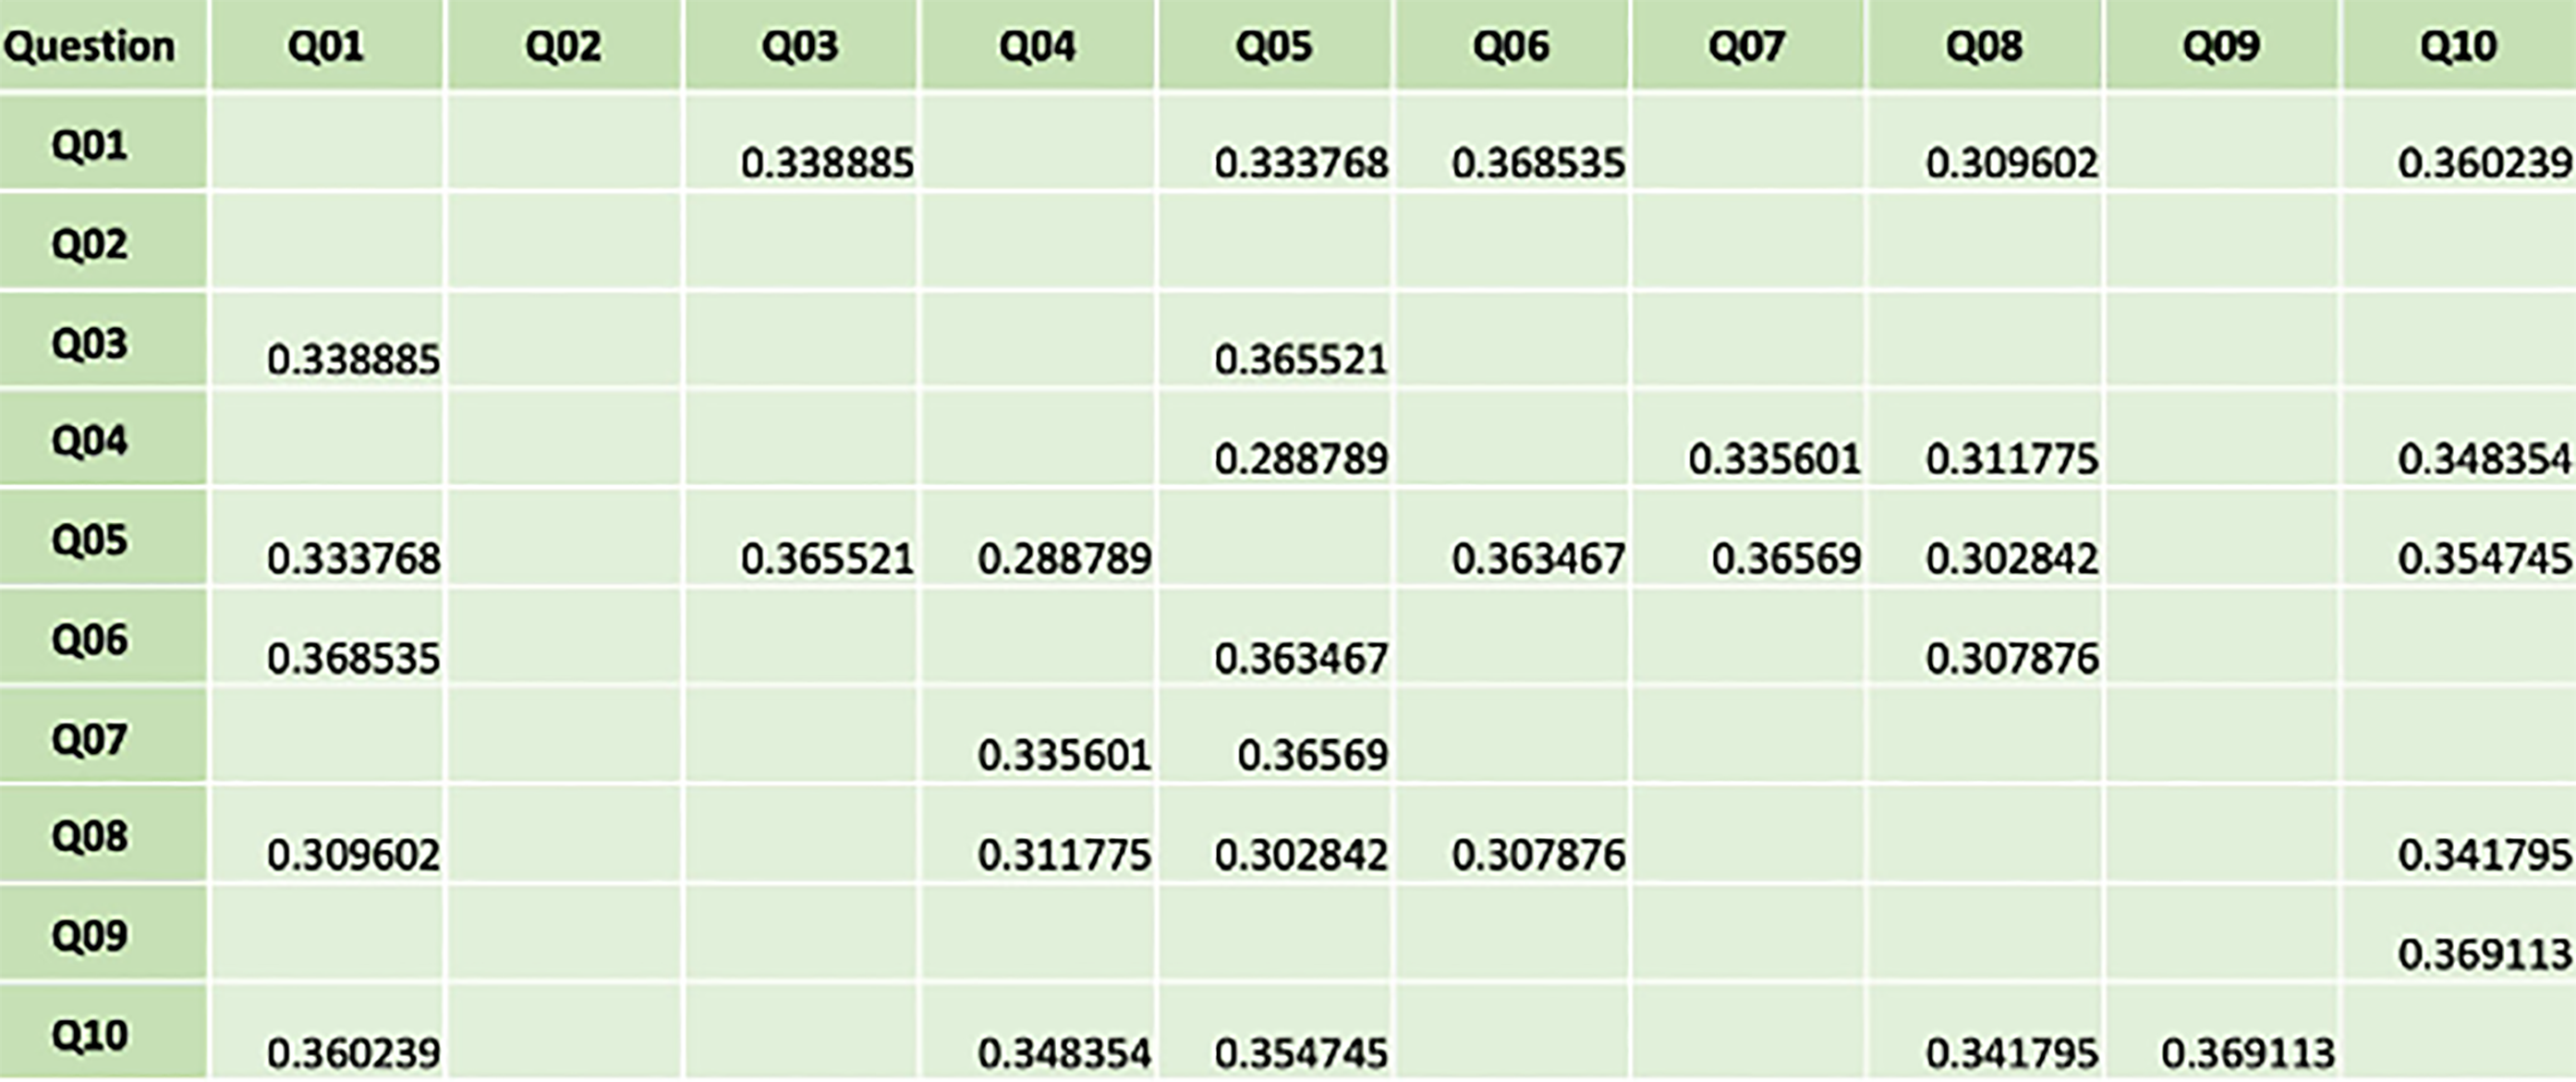
The discussion of the Gini index that follows refers to two types of aggregate score, and it is important to distinguish between them. The aggregate response score of a question refers to the score of just one subcultural group to a question; the average aggregate response score is the average response across all subcultural groups to a question. Whenever reference is made to an “above average” or “below average” score, it will be with respect to the average aggregate response score of a question across all subcultural groups in the organization.
What do these Gini indices in the table mean? Let’s take a look at the configuration of dots in Figure 3. Each dot represents a group’s aggregate response scores to the pair of questions indicated. (The responses can be above-below, above-above, below-below, or below-above the average aggregate score.) You can eyeball it and see that there is an apparent association between the responses to the two questions. The Gini index for the pair of questions with this particular configuration of aggregate responses is 0.37, and this configuration of dots illustrates the limiting case, meaning that the Gini index for any pair of questions must be 0.37 or lower if the questions are to pass the test of being associated. If one of the associated aggregate responses were to change so that just one of the dots moved horizontally (for example, if one of the seven Q1-above/Q2-above dots became a Q1-above/Q2-below dot), then the Gini index would rise, and the test would fail.
Figure 3 – Illustration of a Positive Association in a Two-by-Two Gini Matrix
|
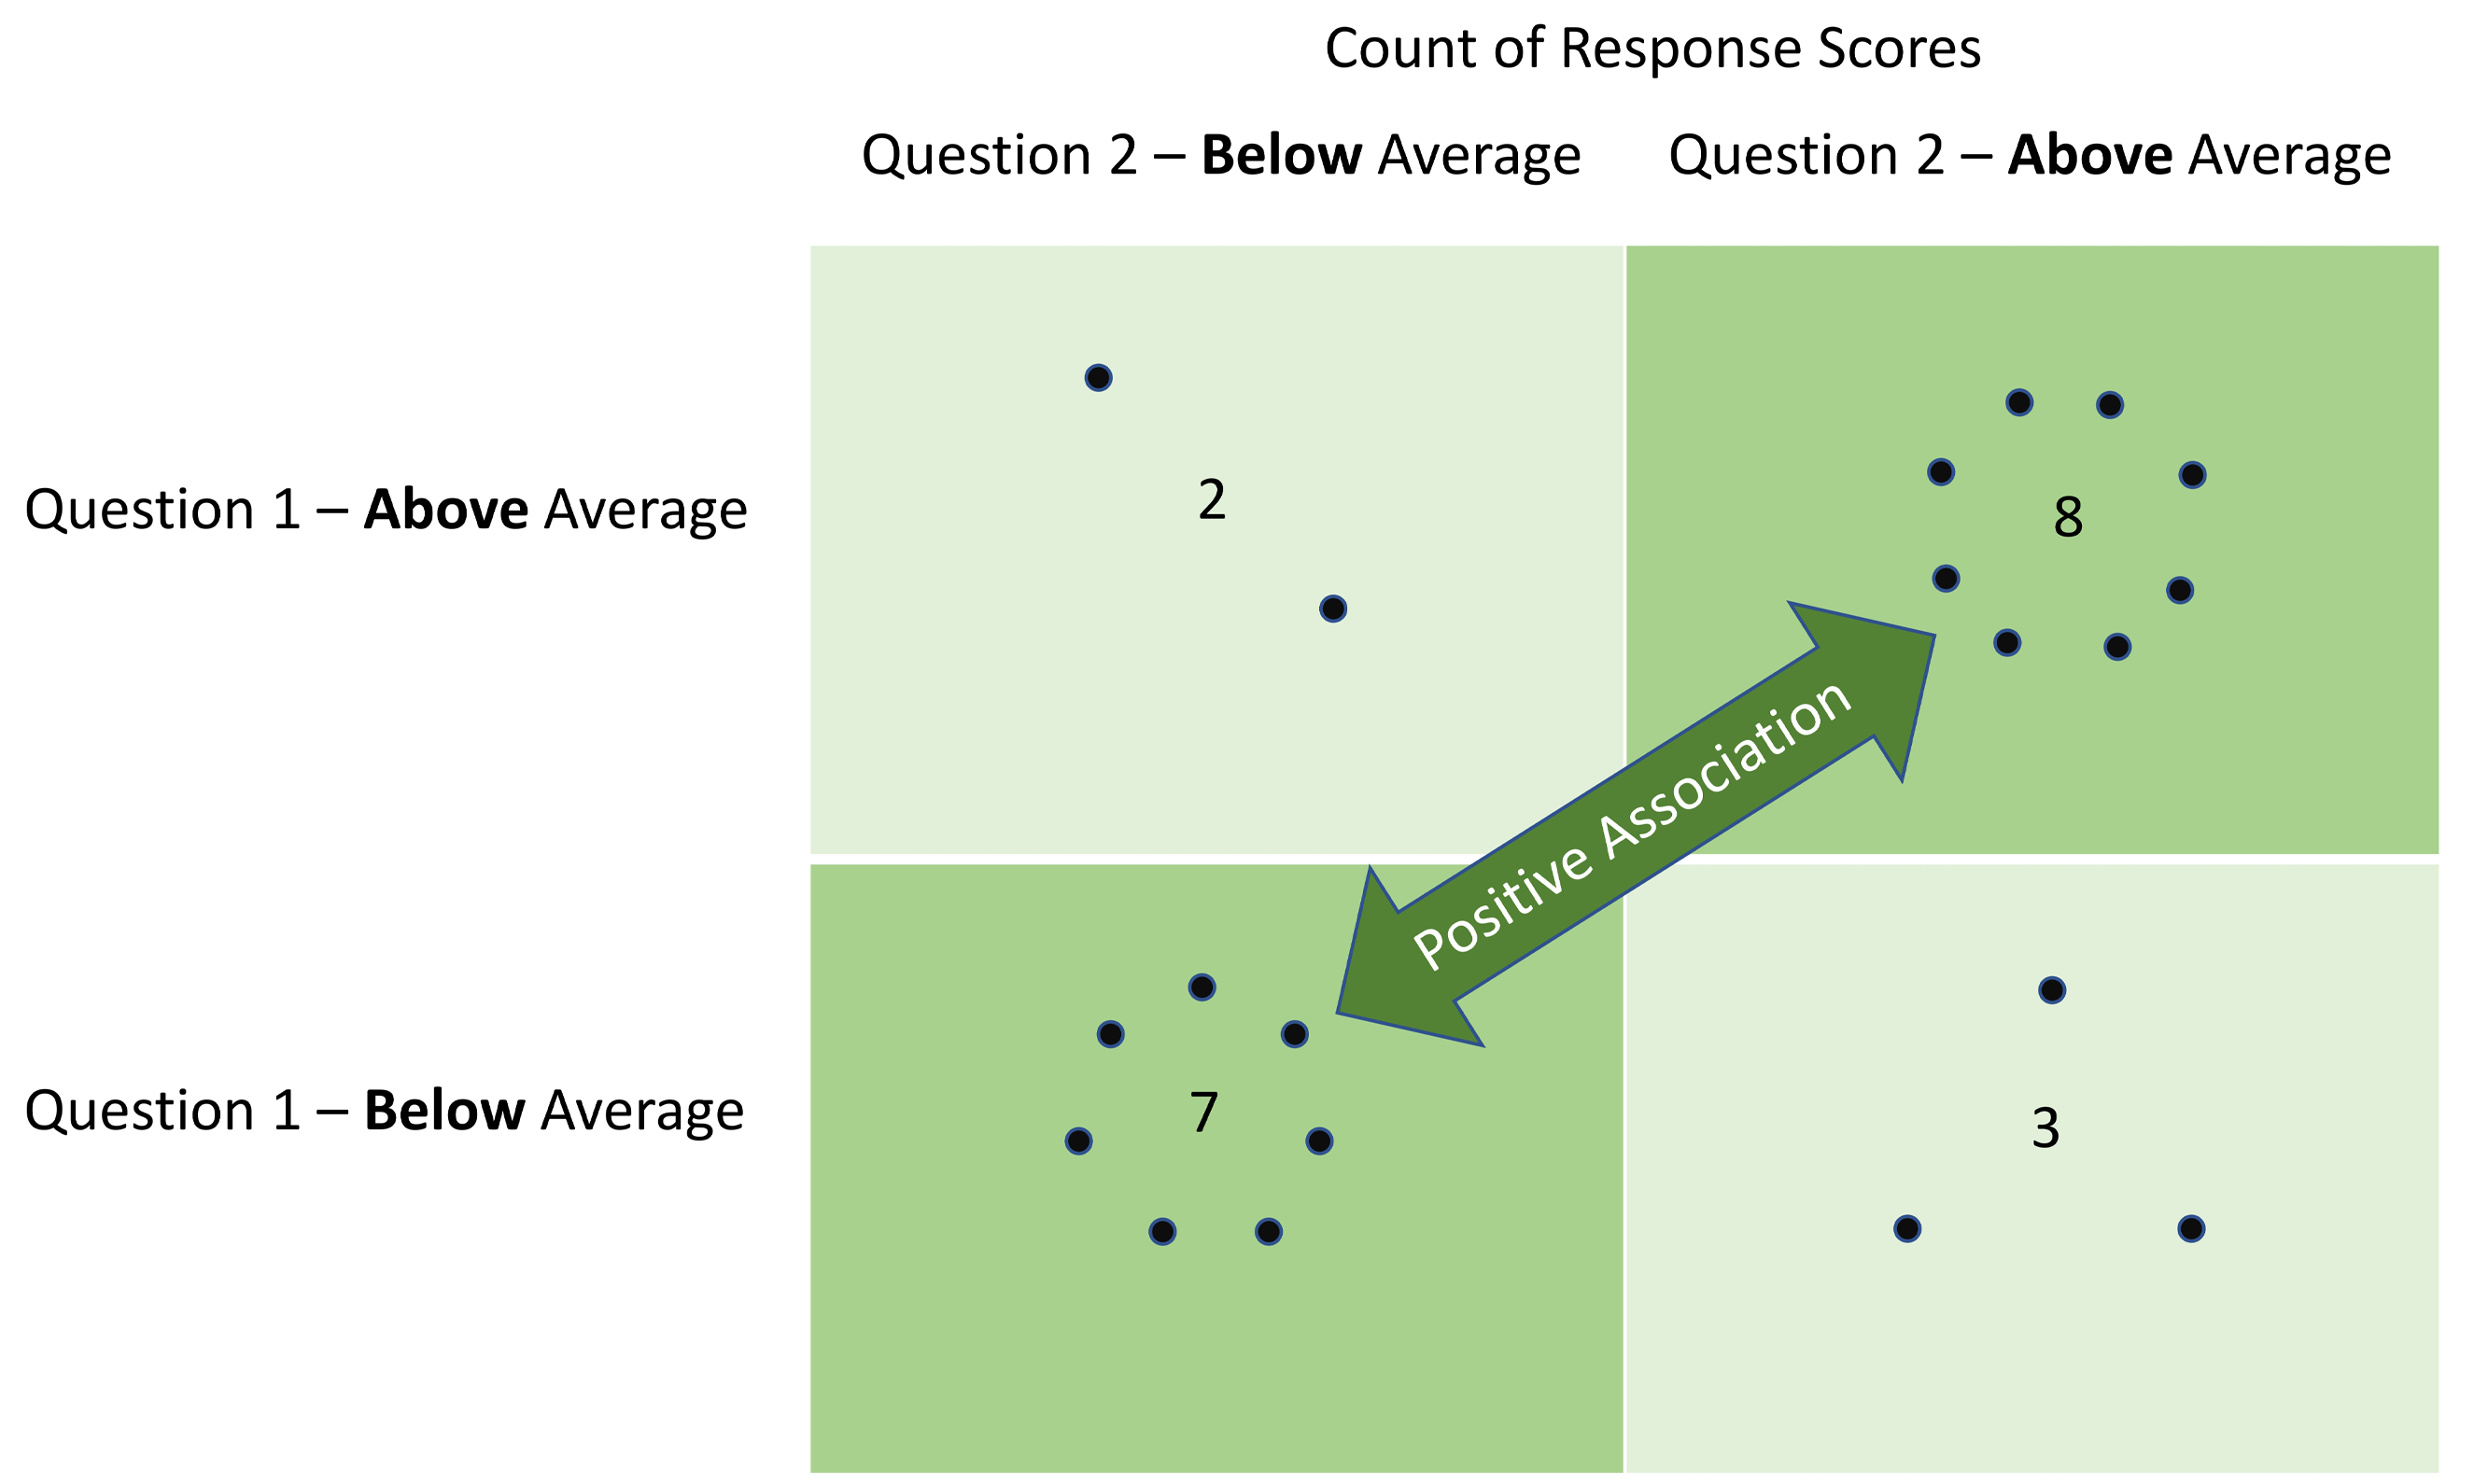
The Gini index is a measure of a sample’s “purity,” where purity in the context of two attributes is a measure of how homogeneously the attributes are distributed throughout the sample. So, if two attributes, such as aggregate score above average and aggregate score below average, are uniformly distributed throughout a sample of two questions (five dots in each square of Figure 3), the Gini purity would be 0.5 (the maximum value). On the other hand, if the sample contains only matching sets of paired scores—say every above-average score on one question is matched with an above-average score on the second question and the same for below-average scores—this would be a 100% positive association, and the Gini index would be 0.
Unlike statistical measures of correlation, the Gini index does not require assumptions about the mathematical relationship or normal distribution of the responses. It can be considered to be a non-metric measure of the association in that it is a programmatic way of identifying what a person would conclude when looking at the distribution of the responses in a two-by-two matrix. The Gini index in itself does not provide us enough information to reach conclusions that could result in changes to the conduct of an audit. Once we have identified which responses are associated, we need to complete the analysis by applying filters that will allow us to determine which responses to survey questions are of most interest.
One of the most important filters is the variability of the responses to a question. Variability means that some parts of the organization are performing better than others, and comparison between the dynamics of these organizational subcultures during the audit can lead to recommendations about what needs to be done to improve.
A second important filter is what might be called the question’s “counts”, which is a count of the number of other survey questions that a given question is associated with. Counts give an indication of how many other responses might be improved just by improving the response to a question that has multiple counts.
Some examples of applied analytics
Filters make the difference between analysis, which summarizes response scores without providing much insight to guide corrective action, and analytics, which highlights top-ranked issues, issues within particular employee groups, and associations between issues. Associations between issues are especially interesting to internal auditors and performance auditors because they provide a basis to conduct root cause analysis and support for recommendations.
For example, analysis might identify an organizational issue with excess approval stages. At first glance, a natural recommendation to resolve this issue might be to reduce management layers and move authority downward. However, analytics might reveal that the issue with approval stages is associated with constantly changing priorities, lack of clear expectations, and confusion about vision, mission, and goals—suggesting that the approvals issue might best be resolved by improving leadership and communication.
To take another example, employee surveys often ask questions about whether employees find the organization a great place to work in. A low aggregate score here, as revealed by analysis, can be alarming, but without applying analytics it may not be obvious what possible corrective action could be taken. Analytics might reveal associated items for follow-up, such as lack of recognition, insufficient resources, and exposure to harassment.
2 Machine learning is a branch of artificial intelligence focused on building applications that learn from data, so as to make decisions and predictions that improve as new data becomes available.
Page 2 of 3
